Article Text

Abstract
Objective In multiple sclerosis (MS), MRI measures at the whole brain or regional level are only modestly associated with disability, while network-based measures are emerging as promising prognostic markers. We sought to demonstrate whether data-driven patterns of covarying regional grey matter (GM) volumes predict future disability in secondary progressive MS (SPMS).
Methods We used cross-sectional structural MRI, and baseline and longitudinal data of Expanded Disability Status Scale, Nine-Hole Peg Test (9HPT) and Symbol Digit Modalities Test (SDMT), from a clinical trial in 988 people with SPMS. We processed T1-weighted scans to obtain GM probability maps and applied spatial independent component analysis (ICA). We repeated ICA on 400 healthy controls. We used survival models to determine whether baseline patterns of covarying GM volume measures predict cognitive and motor worsening.
Results We identified 15 patterns of regionally covarying GM features. Compared with whole brain GM, deep GM and lesion volumes, some ICA components correlated more closely with clinical outcomes. A mainly basal ganglia component had the highest correlations at baseline with the SDMT and was associated with cognitive worsening (HR=1.29, 95% CI 1.09 to 1.52, p<0.005). Two ICA components were associated with 9HPT worsening (HR=1.30, 95% CI 1.06 to 1.60, p<0.01 and HR=1.21, 95% CI 1.01 to 1.45, p<0.05). ICA measures could better predict SDMT and 9HPT worsening (C-index=0.69–0.71) compared with models including only whole and regional MRI measures (C-index=0.65–0.69, p value for all comparison <0.05).
Conclusions The disability progression was better predicted by some of the covarying GM regions patterns, than by single regional or whole-brain measures. ICA, which may represent structural brain networks, can be applied to clinical trials and may play a role in stratifying participants who have the most potential to show a treatment effect.
Data availability statement
Processed data and codes used in this study are available on request from qualified investigators.
This is an open access article distributed in accordance with the Creative Commons Attribution 4.0 Unported (CC BY 4.0) license, which permits others to copy, redistribute, remix, transform and build upon this work for any purpose, provided the original work is properly cited, a link to the licence is given, and indication of whether changes were made. See: https://creativecommons.org/licenses/by/4.0/.
Statistics from Altmetric.com
Introduction
Multiple sclerosis (MS) is an inflammatory and neurodegenerative disease of the central nervous system. The most recognised pathological feature of MS is an inflammatory demyelinating white matter (WM) lesion, whose formation is associated with relapses.1–3 However, the principal driver of irreversible disability, and progressive MS, is thought to be neurodegeneration.4 5 We now have many treatments that reduce the risk of MS relapses, but only have two licensed treatments for progressive MS, and their efficacy appears to be mainly in people who still show evidence of ongoing inflammatory lesion activity.6 7
Neurodegeneration manifests as brain atrophy and this can be measured with MRI.8 Grey matter (GM) volume loss contributes to brain atrophy.5 In patients with secondary progressive MS (SPMS), GM volume loss is faster in the deep grey matter (DGM) than the cortex, and within the cortex, it preferentially affects temporal and parietal regions.5 9 10 However, regional and global brain atrophy, and other conventional MRI measures, only partly correlate with and predict disability progression in people with progressive MS.11 In part, this is explained by pathology being assessed at a whole or regional brain level, while the disability occurs as a result of impaired connections between clinically eloquent regions and brain networks.
Pathology in MS affects some parts of the brain more than others, and ideally, we should seek to measure pathology where it is most likely to affect clinical outcomes. Network-based measures have the potential to add value to conventional MRI measures, and have already proven promising in explaining motor disability.12 Data-driven GM network measures are also a good candidate to be used as prognostic markers in clinical trials. Data-driven measures of brain networks have the potential to select those more likely to progress to enrich clinical trials and so demonstrate treatment effects.
Independent component analysis (ICA) is a robust data-driven technique that has been used to identify brain networks on structural MRI.13 14 Spatial ICA can identify separate brain regions whose volume covaries, which can be linked by a common biological or pathological property.15 16 In a mainly relapsing-remitting (RR) MS cohort, in a cross-sectional study Steenwijk et al identified covarying patterns in cortical thickness associated with clinical outcomes. A previous study in early RRMS showed that covarying patterns of GM intensities at baseline did not predict confirmed disability progression (CDP) within 10 years, or at 10 years differentiate between patients with CDP and without CDP.17 These studies were weighted towards RRMS, and while atrophy occurs early in MS, it is more prominent, and thought to be more clinically relevant,18 19 during the progressive phase. No study so far has looked at the predictive value of baseline network-based measures of the cortex and DGM.
The overarching goal of our study was to apply network-based MRI measures of GM volume changes, seeking to better predict disability progression in SPMS when compared with conventional regional or whole brain volumes. We applied spatial ICA to identify covarying patterns of GM from structural MRI in 988 people with SPMS. Our specific aims were to (1) identify clinically relevant measures of covarying GM volume at study entry and (2) identify patterns of covarying GM volumes that predict future disability progression. We also aimed to assess stability and reliability of these patterns.
Materials and methods
Participants
We re-analysed data from the ASCEND trial, an international (163 sites across 17 countries), phase III, randomised, double-blind, placebo-controlled trial. Baseline and longitudinal clinical and baseline MRI data from 1003 subjects aged 18– 58 years, who had SPMS, and baseline Expanded Disability Status Scale (EDSS) between 3.0 and 6.5, were acquired.20 Clinical data were acquired at baseline, every 12 weeks up to week 108 and at week 156. Because ASCEND was a negative trial, we included data from participants on natalizumab and from those in the placebo arm. We included visits that acquired the following MRI sequences: (1) T1-weighted without contrast administration MRI scans and (2) T2-fluid-attenuated inversion recovery (FLAIR) and/or (3) T2-weighted. We excluded data from (n=15) participants with artefacts on the available scans and re-baselined data from subjects (n=57) with artefacts just on their baseline scan (eg, ghosting, magnetic susceptibility and motion artefacts).
To determine whether similar patterns were present in healthy controls, we randomly selected 400 participants from the Human Connectome Project (males=171, females=229, mean age 28.89±3.74) and downloaded the available three-dimensional (3D) T1 and T2 scans.
MRI acquisition and processing
Image acquisition
Brain scans were acquired at either 1.5 or 3.0 T with two-dimensional (2D) T1-weighted sequences with voxel size=0.98×0.98×3 mm3; (2) fast FLAIR with voxel size=0.98×0.98×3 mm3 and (3) T2-weighted sequences with voxel size=0.98×0.98×3 mm3. Details on MRI acquisition from a representative centre are provided in the online supplemental materials.
Supplemental material
Image processing
The aim of image processing was to extract GM probability maps which are the input to ICA from T1-weighted MRI. We followed the steps as shown in figure 1.

Visual representation of our image-analysis pipeline. Aiming to identify data-driven network-based measures of covarying GM volumes, we initially preprocessed our data as in Eshaghi et al (N4 bias field correction, lesion filling, brain segmentation and parcellation). We created a customised template from all the available scans from 39 randomly selected subjects. After having resampled those scans to an isotropic space, we created 39 single subject templates, and from those an average study-specific template. We registered the T1 lesion filled scans to the template and diffeomorphically transformed the GM segmentation maps to the template using the warping matrix generated from the previous step. We modulated the GM segmentation maps by the Jacobian determinants in order to account for possible deformations to the original volumes occurred after the non-linear transformation. We applied an 8 mm smoothing kernel to account for intersubject variability and applied a whole brain mask to constrain the following analysis at the level of the brain. Aiming to prove the stability of our results, we randomly divided our cohort into four folds. For each fold and for the entire cohort, we generated a 4D image by concatenating the available GM maps and ran fast ICA on each of those inputs allowing for 20 components to be identified. For each fold and for the entire cohort, we generated a 4D image by concatenating the 20 generated ICA components and ran cross-sectional correlations between those inputs to identify which components were stable and could be implemented for statistical analysis. 4D, four-dimensional; ANTs, advanced normalisation tools; GM, grey matter; ICA, independent component analysis.
We used an established pipeline as described elsewhere.21 Briefly, this pipeline included N4 bias field correction,22 lesion filling23 (to reduce the effects of hypointense lesions in T1 scans during segmentation), and used the Geodesic Information Flows (GIF) V.3.024 to segment the lesion filled T1-weighted images into GM, WM and cerebrospinal fluid (CSF) probability maps, as well as to divide the brain into 120 parcellations according to the Neuromorphometrics atlas.25 We used GIF because it allows the inclusion of 2D-MRI data and does not require additional manual editing, which for a cohort of this size would have been unfeasible. EC visually inspected these outputs to check for erroneous segmentation or segmentation outputs.
Voxel-based analysis of GM probability maps
We randomly selected 39 participants to create a study-specific template (as described in online supplemental materials), to improve the accuracy of the registration and minimise bias.26
For each participant, we registered the baseline T1 lesion filled scans to the study-specific template using rigid, affine and diffeomorphic non-linear registrations.27 We calculated the cortical and deep GM volumes from GM probability maps in the native space. We transformed GM probability maps to the template by applying the warping matrices obtained from the previous step. We modulated the GM probabilistic maps by the Jacobian determinants estimated in Advanced Normalisation tools V.2.3.1 to adjust for deformations that occurred to the original volumes after the non-linear registration.17 26 28 We used an 8 mm full width at half maximum smoothing kernel to account for intersubject variability. We created a whole brain parcellation mask (as described in online supplemental materials) to constrain the ICA to the brain, and to identify and label brain regions in each ICA component.
Analysis of covarying GM volumes with ICA
We used the FastICA algorithm29 implemented in scikit-learn 0.23.1 to identify the independent components representing spatial maps of GM covariation (GM patterns). We concatenated the GM probability maps from the ASCEND cohort into a 4D volume and fitted the ICA model allowing for 20 components to be identified.14 30 To assess the stability and repeatability of the identified components, we randomly divided our cohort into four folds (247 subjects each) and repeated the analysis for each fold. We generated a 4D image by concatenating the 20 identified components and assessed pairwise spatial cross-correlations with ‘fslcc’ in FSL31 to select components that were spatially stable for each fold (see figure 1). We defined components with statistically significant correlations (p<0.05) across folds and entire cohort as stable.
To account for heterogeneity of MRI protocols, we split the cohort based on the manufacturer used to acquire the MRI images, and repeated ICA for each subsample. We assessed pairwise spatial cross-correlations between the entire cohort and each cross-validation fold using ‘fslcc’ to determine whether components were stable across manufacturers. To account for between-site variability, we split the cohort based on their geographical region, and repeated ICA for each cross-validation fold. We applied spatial cross-correlations to determine whether the ICA components identified from the entire cohort were stable regardless of the geographical region in which they were acquired and investigate the reliability of data-driven GM networks.
We overlaid the stable components obtained from the entire cohort with our whole-brain mask (obtained as described in online supplemental materials) to label brain areas involved in each component. To infer potential functional relevance, we visually compared the identified GM patterns with functional networks previously reported in the literature.32 33
We repeated ICA for healthy controls as described in online supplemental materials.
We used the loading factors of the stable components for further statistical analysis. Loading factors quantify the contribution of a given subject to a particular component.
Statistical analysis
We computed z-scores from the loading factors for each ICA component, whole brain GM, DGM and other brain regions volumes with R V.3.6.1. To identify components that represent overall brain preservation and brain volume loss, we correlated the loading factors of the ICA components with baseline whole brain GM volume. We correlated ICA factors with whole brain GM volumes, rather than with the volumes of brain regions involved in each component, because we aimed to determine the direction of ICA-brain volume associations, not their true magnitude (correlations are likely to be smaller than they would otherwise have been considering just brain volumes comprised in each network). To further identify which brain areas in each ICA component presented volume loss and which were preserved, we obtained parcellation maps for each participant from the preprocessing stage, estimated the baseline volume of each region and by correlating the baseline volume of each region involved in each ICA component, we determined whether the corresponding regions in the ICA patterns were preserved (positive correlation) or represented volume loss (negative correlation) (see online supplemental materials for additional details). We calculated Pearson’s correlation coefficients across z-scores of ICA components and baseline average (dominant and non-dominant hands) inverse 9HPT (1/9HPT) and SDMT, and Spearman’s correlations between these z-scores and the baseline EDSS, to determine the association between the GM patterns measures and the current clinical status. We calculated correlation coefficients for EDSS, inverse 9HPT and SDMT with the z-scores of lesion load, whole brain GM volume, DGM and thalamus volume.34 35 To account for the number of comparisons performed, correlations were corrected for multiple comparisons using Bonferroni correction (a=0.05).
To calculate time to worsening of physical and cognitive disability, we estimated the EDSS progression as an increase of 1 point from a baseline EDSS score of 5.5 or below, or of 0.5 points from baseline EDSS score >5.5, and these scores were confirmed at least at 3 months.36 We excluded from this estimation all the clinical visits within 30 days of an MS relapse. We also estimated the 9HPT and SDMT worsening as respectively a 20% increase36 37 and 10% decrease38 39 with respect to the baseline score.
We performed Cox regression analysis to determine whether the standardised loading of GM patterns at baseline could predict the clinical disability. We built one model for each independent variable (ie, ICA components, whole brain atrophy, DGM atrophy, lesion load and atrophy in smaller regions), adjusting for age, gender, trial arm and centre, and having the event and the time-to-event as dependent variables. We used the date of the baseline clinical visit, and the date of the clinical visit at which participants had an event or the last available clinical visit (in case no event was detected), to estimate the time-to-event.
To determine whether data-driven patterns provide added value above to regional MRI volumes and lesion loads, we performed post hoc analysis with multivariate Cox proportional regression analysis. To identify the best predictive model for 9HPT and SDMT progression, we defined the following three models and obtained their concordance indexes (C-index):
15 stable ICA components;
15 ICA components together with conventionally used MRI measures (whole brain GM, DGM and lesion load);
conventionally used MRI measures
We estimated the C-index, which is a measure of the discrimination power of survival models, and represents the proportion of subjects with a progression on the clinical test and a worse outcome predicted by the model (concordant pairs) divided by the total number of possible evaluation pairs.40 A C-index of 1 represents a perfect model prediction, while a value of 0.5 denotes random prediction. Age, gender, trial arm and centre were used as covariates for each model.
Data availability
Processed data and codes used in this study are available on request from qualified investigators.
Results
Participants
For 15 subjects, their scans did not meet our inclusion criteria. Therefore, our final cohort comprised 988 patients with SPMS (366 men and 622 women with mean age of 46.71±7.70). Table 1 reports the demographic characteristics of these patients.
Characteristics of participants
We performed a two-sample test for equality of proportion to determine whether the randomly selected subcohort was representative of the entire cohort for the strength of the acquisition field and gender. The proportion of participants scanned at 1.5 and 3 T did not differ in the two samples (respectively, χ2=0.86, df=1, p=0.35, 95% CI −0.19 to 0.77 and χ2=0.30, df=1, p=0.59, 95% CI −0.10 to 0.17). The proportion of females and males in the two samples did not differ (respectively, χ2=2.10, df=1, p=0.15, 95% CI −0.03 to 0.25 and χ2=2.10, df=1, p=0.15, 95% CI −0.25 to 0.03]).
Spatial maps of ICA components overlap with previously known networks
While allowing for up to 20 components, spatial cross-correlation showed that 15 (figure 2) were stable (online supplemental table s1). As reported in online supplemental table S2 and S3, components were stable regardless of the geographical region or the scanner vendor.

Stable independent component analysis (ICA) components. To determine the stability of the ICA components, we randomly split the sample into four folds and ran the ICA on each of them, as well as on the entire sample. While allowing for 20 components to be identified, cross-sectional correlations proved that only 15 out of the 20 ICA components were stable (emerged in all of the four folds and from the entire sample). The colour bar represents the loading of each component. Most of the identified networks resampled well-known functional systems. Component 3 represents an auditory-like network, spanning mainly the superior temporal gyrus, posterior insular and Heschl’s gyrus (cognition-language-speech network). Component 5 is a sensorimotor-like network, encompassing the precentral gyrus, postcentral gyrus and supramarginal gyrus (action-execution network). Component 6 resamples a cerebellum-like network, involving mainly the cerebellum and fusiform gyrus, temporal and parietal lobe. Component 8 is a cortico-basal ganglia-like network, spanning the brain stem, pons, thalamus, nucleus accumbens, insula, putamen, caudate, pallidum, frontal and temporal lobe. Component 9 represents an executive control-like network, involving mainly medial frontal areas (action planning and inhibition). Component 11 is a visuo-like network, encompassing mainly several regions of the occipital pole and supramarginal, temporal and parietal areas. Component 15 resamples a salience-like network, involving the insula, thalamus and striatus (autonomic reaction to salient stimuli; goal-directed behaviour). Component 17 represents an affective and reward network, encompassing mainly the anterior cingulate, medial orbitofrontal cortex and prefrontal cortex. Component 20 resamples a default mode-like network (DMN-like), spanning mainly the precuneus, posterior cingulate and middle frontal gyrus. The remaining identified networks did not correspond to any major brain functional network, but can be labelled by their predominantly involved brain areas. Component 1 is a superior frontal network, encompassing mainly superior and medial frontal brain areas. Component 2 is a temporal-like network, involving mainly temporal brain regions. Component 7 is a precuneus-like network. Component 12 is an occipito-temporal-like network, spanning mainly the temporal and occipital pole. Component 13 represented a prefrontal cortex-like network, involving mainly frontal and orbitofrontal brain areas. Component 18 is a parieto-temporal-like network, involving mainly temporal and parietal brain areas.
Nine of the identified structural GM patterns partially overlapped well-known functional systems, however ICA components spanned more areas compared with the functional networks. For example, component 5 is a sensorimotor-like network, encompassing the precentral gyrus, postcentral gyrus and supramarginal gyrus (action-execution network). Component 8 is a cortico-basal ganglia-like network, spanning the brain stem, pons, thalamus, nucleus accumbens, insula, putamen, caudate, pallidum, frontal and temporal lobe. Component 20 resamples a default mode-like network (DMN-like), spanning mainly the precuneus, posterior cingulate and middle frontal gyrus. For a detailed description of the remaining networks and of regions associated with each component, see figure 2, online supplemental table S4 and table 2.
List of the clinically significant components with their corresponding involved brain regions
Patterns represent brain volume loss or preservation
We identified ICA components representing a mixture of relative brain preservation and brain volume loss. Two representative examples are:
Component 20 was positively correlated with whole brain GM volumes (r=0.28, 95% CI 0.22 to 0.33, p<0.001). Higher component loading was associated with higher GM volume, therefore this component represents a pattern of relatively greater regional volume at baseline.
Component 13, instead, was inversely correlated with whole brain GM (r=−0.38, 95% CI −0.43 to −0.33, p<0.001). Higher loading on component 13 was associated with lower whole brain GM volumes, thus this pattern represents brain volume loss. Online supplemental table S5 shows correlations between the loading of each ICA component and whole brain GM volumes.
We identified which brain region in each GM pattern had brain volume loss and which was preserved (see table 2 and online supplemental table S4).
Baseline GM patterns correlate with clinical measures
Among all ICA components, component 8 (in which higher values corresponded to lower basal ganglia volumes) was significantly correlated with the SDMT and inverse 9HPT (respectively, r=−0.44, 95% CI −0.52 to −0.36], p<0.001 and r=−0.32, 95% CI −0.38 to −0.25, p<0.001). Component 6 (in which higher values corresponded to higher cerebellar volumes) was correlated with EDSS (rho=−0.11, p<0.05) (figure 3). Overall, SDMT and 9HPT showed higher correlation coefficients with some ICA component (especially component 8) than with conventional MRI measures (online supplemental table S5 and S6).
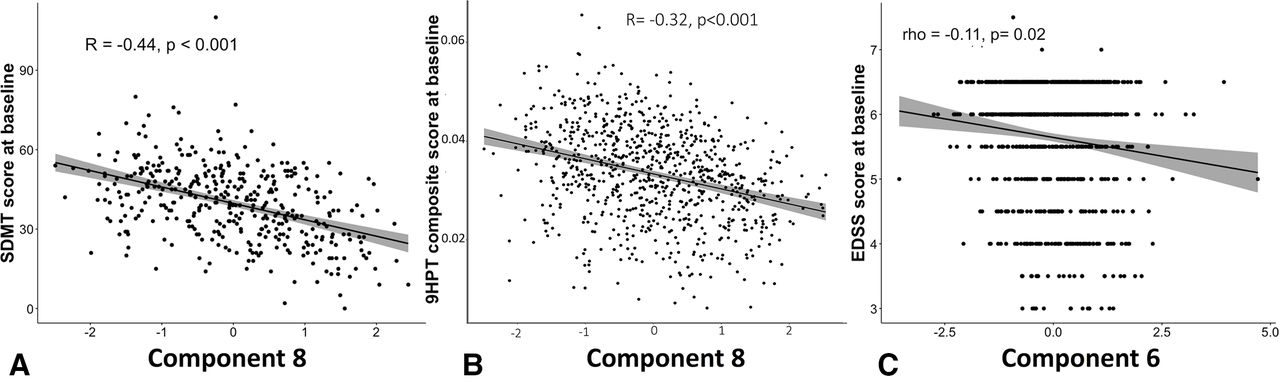
Correlations between baseline ICA components and baseline EDSS, 9HPT and SDM. Among the 15 stable ICA component, baseline SDMT score was more strongly associated with a mainly basal ganglia component (component 8). Among the three clinical tests, (A) SDMT had the highest correlations with ICA networks (mainly with component 8). (B) 9HPT was associated with the factor loading of component 8. 9HPT and SDMT correlated better with some ICA networks rather than with any other regional or whole brain MRI measure. (C) Among all the 15 networks, component 6 (ie, cerebellum, brain stem, pons) had the highest correlation with EDSS. We used the Bonferroni correction to correct for multiple comparisons. CI band is added to the figure. EDSS, Expanded Disability Status Scale; ICA. independent component analysis; SDMT, Symbol Digit Modalities Test; 9HPT, Nine-Hole Peg Test.
Predicting disability progression with survival modelling
Predicting the risk of 12-week confirmed EDSS progression
Data were available for 840 participants (317 males, 523 females, 419 patients under disease-modifying treatment (DMT), 421 patients in the placebo group, mean time-to-event of 1.98 years). A total of 28.5% of subjects had 12-week confirmed EDSS progression (figure 1). None of the ICA patterns predicted EDSS progression.
GM patterns predicted 9HPT worsening
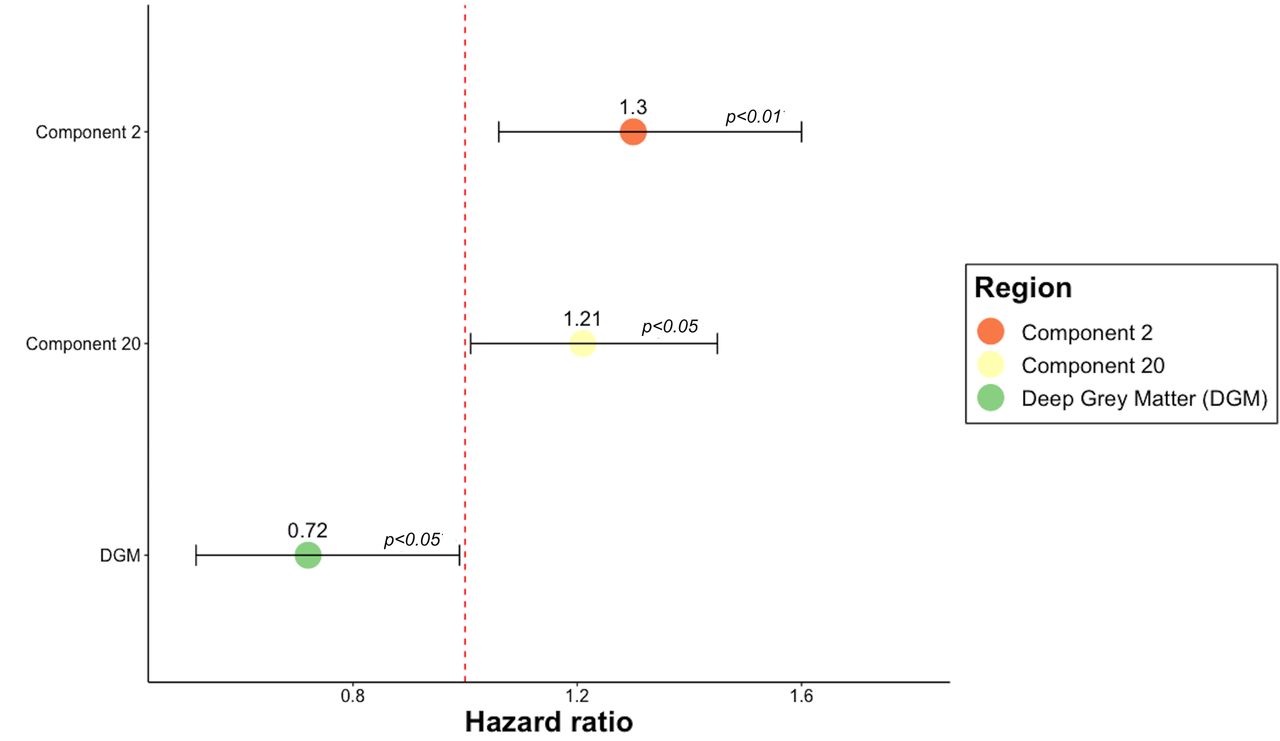
Data for 361 subjects were available (134 males, 227 females, 191 patients under DMT, 170 patients in the placebo group). By the last available visit, 42% of participants experienced a worsening in the 9HPT after a mean time-to-conversion of 1.76 years (online supplemental figure S2). Component 2 (HR=1.30, 95% CI 1.06 to 1.60, p<0.01), component 20 (HR=1.21, 95% CI 1.01 to 1.45, p<0.05) and DGM (HR=0.72, 95% CI 0.52 to 0.99, p=0.05) predicted the worsening of the 9HPT (figure 4 and online supplemental table S7).

Cox regression models predictive of 9HPT worsening. HR of the statistically significant predictors of 9HPT worsening. The figure shows that two GM networks and the volume of the DGM can predict the 9HPT progression. HR >1 indicates that for each SD increase in the corresponding variable there is a higher risk of developing the event. HR <1 indicates that for each SD decrease in the corresponding variable, there is a higher risk of progressing on 9HPT. Error bars represent the CI. P values <0.05 represent a statistically significant relative risk of developing a 9HPT progression comparing subjects for each independent variable shown on the vertical axis. Component 2 encompasses the temporal lobe, middle cingulate gyrus, precentral gyrus medial segment, posterior cingulate gyrus, parietal lobule, inferior and middle temporal gyrus, parahippocampal gyrus, fusiform gyrus and entorhinal area. Component 20 consisted of precuneus, posterior cingulate gyrus, middle and superior frontal gyrus, angular gyrus, superior occipital and superior parietal lobule. 9HPT, Nine-Hole Peg Test; GM, grey matter.
GM patterns predicted SDMT worsening
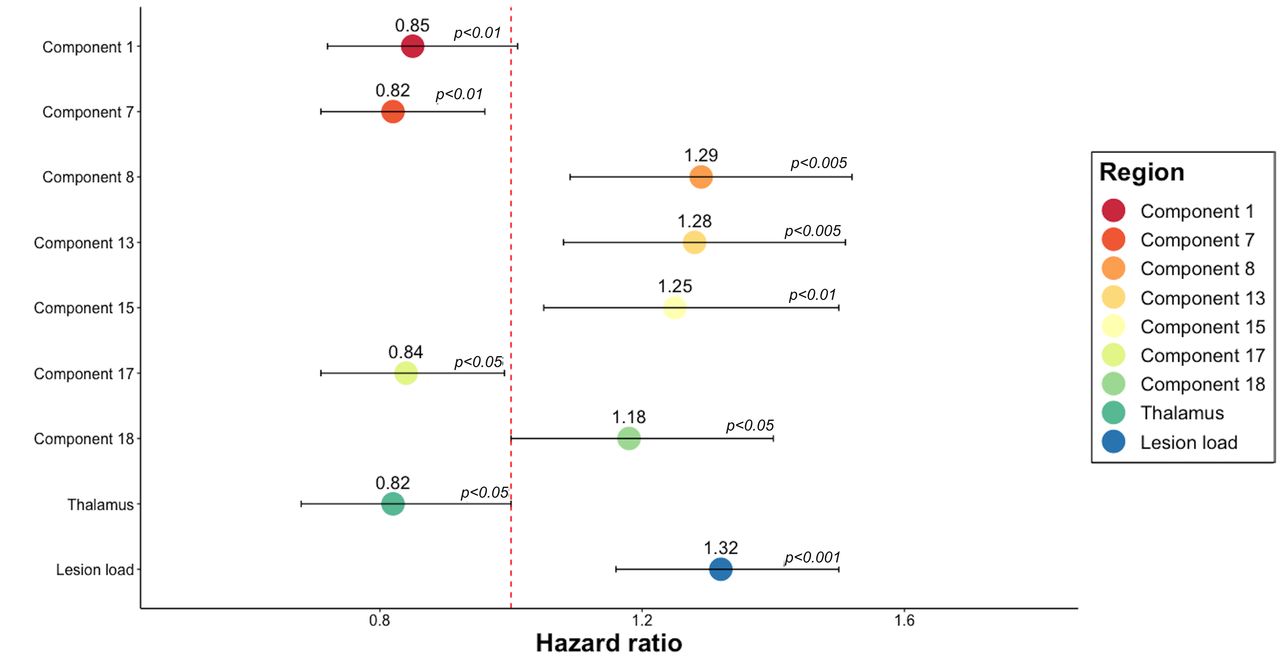
SDMT was available for 360 (140 males, 220 females; 185 under DMT, 175 in the placebo group) subjects. By the last available visit, 51% of participants had a 10% worsening39 in SDMT score after a mean time-to-conversion of 1.36 years (online supplemental figure S3). SDMT worsening could be predicted by six of ICA components (component 7, component 8, component 13, component 15, component 17, component 18), lesion load and thalamus (figure 5 and online supplemental table S7).

Cox regression models predictive of SDMT worsening. HR of the statistically significant predictors of SDMT worsening in separate Cox regression models. The figure shows that six ICA components, lesion load and the volumes of the thalamus could predict the SDMT progression. HR >1 indicates that for each SD increase in the corresponding variable, there is a higher risk of developing the event. HR >1 indicates that for each SD decrease in the corresponding variable, there is a higher risk of progressing on SDMT. For each SD increase in component 8 (encompassing mainly basal ganglia regions), which is inversely related to GM volumes, there was a 29% higher risk of developing SDMT progression. For each SD decrease in the volume of the thalamus, there is a 18% increased risk of worsening in SDMT. Error bars represent the CI of HR. P values <0.05 represent a statistically significant relative risk of developing an SDMT progression for each independent variable shown on the vertical axis. GM, grey matter; ICA. independent component analysis; SDMT, Symbol Digit Modalities Test.
GM patterns add value to conventional MRI measures: Cox proportional regression analysis
Models with ICA components had a higher C-index (C-index=0.69 (SE=0.025) compared with models including only conventional MRI measures (C-index=0.65, SE=0.025) (table 3).
Comparison between different predictive models for 9HPT and SDMT progression
The highest C-index belonged to a model with all ICA components (C-index=0.72, SE=0.021). When compared with models including just conventional MRI measures (C-index=0.69, SE=0.022), models that also include ICA components had higher C-index >0.71 (SE=0.021) (table 3).
Discussion
Our main finding is that data-driven patterns of GM volume change predict physical and cognitive disability in a large cohort of people with SPMS. Furthermore, some of the GM ICA components correlated more closely with concurrent disability than regional or whole brain GM volumes, and some pattern-derived measures better predicted disability progression: two of these patterns predicted the 9HPT worsening and six components predicted cognitive disability better than any other assessed MRI measures. Post hoc analysis showed that pattern-based measures added value to conventional MRI measures. Interestingly, the components that correlated with concurrent disability were not necessarily the same as those associated with progression.
We found that some ICA components showed higher correlation coefficients with disability than regional and whole brain measures. For each disability measure, different ICA components dominated, encompassing both cortical and subcortical areas. For EDSS, it was component 6, which included regions in the cerebellum, brain stem, pons, lingual gyrus, fusiform gyrus, temporal and parietal lobe. For 9HPT, components 6 and 8 (thalamus, brain stem, pons, ventral diencephalon, insula, accumbens, caudate, putamen, pallidum, frontal and temporal lobe) were significant, and for the cognitive dysfunction (SDMT) five components spanning mainly the precuneus, posterior cingulate, temporal and frontal brain regions dominated. While the highest correlation coefficient for SDMT and 9HPT were reported with ICA component 8 (respectively, r=−0.44, 95% CI −0.52 to −0.36, p<0.001 and r=−0.32, 95% CI −0.38 to −0.25, p<0.001), lesion load and thalamus volume had higher correlation coefficients than other GM patterns. EDSS at baseline was more strongly associated with component 6 than DGM, whole GM atrophy and lesion load measures, but the volume of the thalamus in isolation had a higher correlation with EDSS. While whole brain GM and DGM measures span the whole brain, considering several regions not associated with the lower limb functions, component 6 comprised primarily (but not only) areas related to motor functions. Nonetheless, the involvement in this pattern of brain regions not related to motor functions might have decrease the strength of the correlation with EDSS score when compared with the volume of the thalamus taken in isolation. Thalamus is a neuralgic site for motor control, which has already been reported to be associated with EDSS.41
We found baseline ICA components correlated with baseline and longitudinal 9HPT and SDMT measures, and baseline EDSS, but did not predict EDSS progression. Correlation coefficients for EDSS and ICA components were mild to negligible and may not be clinically relevant. While correlations were statistically significant after applying Bonferroni correction and these values are in line with previous reports,9 42–44 the statistical significance might have emerged because of the large sample size. We used correlations as a starting point to determine whether the identified components were associated with the current clinical status of patients with SPMS. We then applied survival models to determine the clinical relevance of GM patterns measures. Moreover, while ICA components may have greater relative clinical effects earlier and later in the course of MS, the limitations of disability measures, which are well-recognised for EDSS, might play a role. The EDSS was designed as a composite score, but is heavily weighted towards walking impairment, particularly affecting mid to higher score ranges (such as patients with progressive MS in our cohort, in which lower limb functions were already heavily impaired).45 In contrast, the 9HPT and SDMT were designed as more specific measures and are more likely to reflect the effects of pathology. Finally, in patients with SPMS the preservation of upper limbs and cognitive functions—poorly represented by the EDSS score—are paramount. Thus, we can conclude that ICA components are marker of disease worsening in SPMS, but only as reflected by 9HPT and SDMT.
While the ICA components were identified without prior knowledge of functionally relevant brain regions, their correlations with disability reinforce their usage in predictive models. These components include regions linked with specific neurological and cognitive functions and also those that were both functionally and structurally related. Component 8, which was mainly a basal ganglia-fronto-temporal pattern, correlated with 9HPT and SDMT at baseline. It includes regions of DGM and cortical areas known to be involved in motor control, memory and learning.46 These regions are also part of the cortico-thalamic, cortico-basal ganglia-thalamo-cortical and thalamo-cortical pathways that control both sensory and motor information coming from and going to the cortex.47 Basal ganglia represent a series of interconnected subcortical nuclei which are known to be involved in selecting and implementing purposeful actions, facilitating voluntary movements and inhibiting the competing or interfering ones, and controlling non-motor behaviours (eg, working memory, procedural learning, decision making, higher-order process of movement initiation).47 48 Moreover, atrophy in the cortex, caudate, putamen, globus pallidus, thalamus and nucleus accumbens have been reported to be associated with lower performance in the SDMT.49 Component six was mainly a cerebellar pattern. It encompassed brain regions in close proximity and functionally related (cerebellum, brain stem, pons, parietal lobe), already known to be involved in motor functions.
Consistent with previous work in predominantly RRMS populations, we found covarying and clinically relevant patterns of GM atrophy. Previous studies using ICA have identified 817 and 109 GM components. In the present study, we looked for 20 components, a practical maximum given available computational power, but found 15 could be consistently identified. Our ICA components only partially overlapped with previously reported GM patterns. For instance, component 5 resembled pattern 2 in the study by Steenwijk et al (they both include the middle temporal gyrus, superior temporal gyrus, supramarginal gyrus, postcentral gyrus and parietal lobule). However, in addition our ICA component includes other brain regions (cuneus and frontal gyrus) not reported by the previous study. Pattern 8 reported by Bergsland et al encompasses similar brain areas as in the ICA component 7 presented here (eg, calcarine cortex, precuneus, occipital and frontal lobe). However, a perfect match is never present and overall GM patterns presented in this study encompass a higher number of brain regions when compared with the above-mentioned studies. Most patterns identified in other studies were not replicated here, nor between studies. There are several potential reasons for this. First, cohort difference: when compared with the study by Bergsland et al, differences in our results may be related to more severe atrophy in SPMS compared with RRMS. Then there are methodological differences, for example, we used GM volumes as input to the ICA instead of cortical thickness, and we allowed for more components to be extracted. Further work is required to resolve these inconsistencies, but a clear overarching finding is that ICA-based analyses identify overlapping components which could otherwise be lost in whole brain and regional atrophy measures, and that these components are clinically relevant.
ICA components represent brain GM volumes that covary, not necessarily in the same direction. Six components showed both positive and negative loading values. This is consistent with previously reported studies on structural ICA where authors identified 5 components out of 10 that encompassed both relatively preserved and relatively atrophied brain regions.9
We can speculate that the interplay of several factors and mechanisms might explain the observed patterns.15 50 For instance, DGM (in particular the putamen and caudate) is known to present several connections with motor and associative cortices, but appear to be susceptible sites for extensive demyelination and iron deposition.51 Other brain regions involved in ICA components are known to be more susceptible to neurodegeneration due to CSF exposure (deep sulci in the temporal pole) and hypoxia (pallidum, precuneus and posterior cingulate). For example, the precuneus and posterior cingulate present extensive connections with several other brain regions and are part of the default brain functional system, known to present under normal condition the highest level of energy consumption.52 Because neurons require a higher amount of energy to adapt to demyelination,53 this could make highly connected brain regions more susceptible to neurodegeneration. Therefore, several mechanisms can cause the observed patterns of volume changes. Future work with longitudinal ICA studies will investigate this further.
Our study has some limitations. In this study, we re-analysed data from a large, negative, multicentre study, where MRI data were acquired with different scanners. External validation was not performed because data from another SPMS cohort were not available. However, we performed cross-validation for the different vendors and acquisition regions to determine whether they could affect the identified patterns. We found that components were stable among cross-validation folds. To take into account the effect of centre had on the association and predictive ability of MRI measures on clinical outputs, we used the centre as covariate in our regression models. Non-isotropic 2D T1-weighted scans were acquired, and while we were still able to measure cortical volumes, and identify multiple ICA components, isotropic 3D scans may enable future studies to identify additional components. Although high-resolution 3D T1-weighted scans would enable cortical thickness rather than volumes to be measured, and so may reveal different ICA patterns that we have been unable to detect and may improve on the predictive power of ICA measures, with baseline 2D T1-weighted scans we detected patterns of GM that predicted both motor and cognitive disability. Considering the broader availability of low resolution 2D scans in phase III clinical trials,54 these findings reinforce the applicability of ICA patterns to both 2D and 3D images, and underline that 2D MRI can be analysed in retrospective imaging studies.
We preferred GM volumes over cortical thickness measures as input for ICA because we were also interested in changes of subcortical brain regions. Similar to previous works, we smoothed the probability maps to account for intersubject variability, but this will have reduced sensitivity to small regional effects, although offset by the large size of the cohort.
This study focused on GM patterns, however MS is a generalised disorder, and so while our ICA components often complemented whole or regional brain GM measures, future work will determine whether WM regions could increase the predictive accuracy of pattern-based measures. Because we used data from a phase III clinical trial, no data for healthy controls were available thus we cannot exclude whether the same patterns would be identified and how they would differ among healthy controls. Using MRI for healthy controls from the HCP, nine GM patterns identified from patients with SPMS were uniquely correlated and present also in healthy controls, suggesting that they are not disease specific. Two GM patterns identified from participants with SPMS (component 5 and 9) were spatially correlated with and represented respectively the sensorimotor element and the frontal element of a single GM pattern detected from HC. The same was true for components 7 and 11 identified from subjects with SPMS that represented different regions and correlated with a single HC GM pattern. A disconnection might explain the inability of ICA to detect component 5 and 9, and 7 and 11 as single GM patterns in participants with SPMS. However, data from HC and patients with MS acquired with the same protocol are needed to clarify this further. Although slightly overlapping with HC patterns, two SPMS ICA components (component 12 and 18) were detected in patients with MS but not from HCs, which might be disease specific. These GM patterns spanned mainly temporal regions that are known to be affected in patients with SPMS.9 These regions are subserved by WM tracts impaired in SPMS. Particularly, a previous ICA study, based on DTI data from people with SPMS, has shown that among all WM tracts, the anterior commissure and corpus callosum show the most extensive WM abnormalities and the strongest correlations with cognitive deficits.55 While our analysis of HCs allows us to assess whether or not patterns are more or less MS-specific, we cannot directly compare ICA measures between the MS and HCs because the MRI scans were acquired with different protocols. While these components provide predictive value, further work is required to determine which components represent general structural variability that may be seen in general population, and those more specific to MS.
Because of the cross-sectional nature of this study, baseline MRI were used to predict longitudinal clinical disability. This represents a limitation of the study because it does not allow to determine causal relationships in brain network changes nor the dynamics of networks. Previous longitudinal studies have determined longitudinal evolution of structural GM networks in RRMS.56 Similarly, a longitudinal study on structural brain networks obtained from cortical thickness in patients with primary progressive MS reported changes in network dynamics (increased connectivity and efficiency) from baseline to year 5 of follow-up mainly in patients with a fast disease progression.57 Nonetheless, the cross-sectional nature of the study does not undermine the ability of baseline MRI data to predict cognitive and motor worsening and their relevance for clinical applicability. Recognising the importance and compelling utility of longitudinal studies, future longitudinal studies should investigate longitudinal changes and reorganisation of GM patterns.
C-indexes were close, but all statistical models were statistically significant and models that considered ICA components had higher accuracy and smaller SE. It therefore means that by adding ICA, we were able to predict outcomes with higher accuracy but the effect sizes were small. ICA can identify clinically relevant relationships in covarying brain regions and might provide new insights into the disease pathomechanisms. Therefore, although the accuracy of predictions is good but not excellent, the little improvement provided by ICA components is rewarding.
We used conventional norms and a raw score change of 4 point (10% change in magnitude) as a clinically meaningful measure39 to define SDMT progression. However, future studies should investigate whether regression-based norms for SDMT might better detect abnormal performance in patients with MS58–60 and therefore improve the performance of ICA components.
In conclusion, we have shown that ICA identifies regional patterns of GM volume loss, several of which are relevant to concurrent disability and some predict future progression. Several of the ICA-derived GM patterns were more closely linked with disability, and better able to predict disability progression, than simple MRI measures. Since the source data for this study was a phase III clinical trial, the ICA pipeline we have developed can readily be deployed in future clinical trials. Given the ability of some components to predict future progression, they could be used to stratify those who are more likely to progress.
Data availability statement
Processed data and codes used in this study are available on request from qualified investigators.
Ethics statements
Ethics approval
The Institutional Review Board at the Montreal Neurological Institute (MNI), Quebec, Canada approved this study under the auspices of International Progressive MS Alliance (reference number: IRB00010120).
Acknowledgments
This study was supported by the International Progressive MSAlliance (IPMSA, award reference number PA-1603-08175). The authors are grateful to all the IPMSA investigators who have contributed trial data to this study as part of EPITOME: Enhancing Power of Intervention Trials Through Optimised MRI Endpoints network.DC,FB and OC are supported by the NIHR biomedical research centreat UCLH. Data collection and sharing for part of this project was provided by the Human Connectome Project (HCP; PrincipalInvestigators: Bruce Rosen, M.D., Ph.D., Arthur W. Toga, Ph.D.,Van J. Weeden, MD). HCP funding was provided by the NationalInstitute of Dental and Craniofacial Research (NIDCR), the National Institute of Mental Health (NIMH), and the NationalInstitute of Neurological Disorders and Stroke (NINDS). HCP data are disseminated by the Laboratory of Neuro Imaging at theUniversity of Southern California.
References
Supplementary materials
Supplementary Data
This web only file has been produced by the BMJ Publishing Group from an electronic file supplied by the author(s) and has not been edited for content.
Footnotes
Twitter @elisacolato, @es_arman
Contributors AE, DTC, OC, EC, SN, DLA and FB designed the study. EC, JS and AE carried out the image analysis. EC and CT performed the statistical analysis. EC, AE, DTC, OC, FB, CW-K, SN, DLA and JS interpreted the data and wrote the manuscript
Funding This study was supported by the International Progressive MS Alliance (IPMSA, award reference number PA-1603–08175). This study was supported by the National Institute for Health Research University College London Hospitals Biomedical Research Centre. DC, FB and OC are supported by the NIHR biomedical research centre at UCLH. OC is NIHR Research Professor (RP-2017-08-ST2-004). She also receives funding from MRC Research Grant (MR/S026088/1). Data collection and sharing for part of this project was provided by the Human Connectome Project (HCP; Principal Investigators: Bruce Rosen, MD, PhD, Arthur W. Toga, PhD, Van J. Weeden, MD). HCP funding was provided by the National Institute of Dental and Craniofacial Research (NIDCR), the National Institute of Mental Health (NIMH) and the National Institute of Neurological Disorders and Stroke (NINDS). HCP data are disseminated by the Laboratory of Neuro Imaging at the University of Southern California.
Disclaimer The authors have no competing interest with respect to this research. The full disclosure statement is as follows: CT has received an ECTRIMS Post-doctoral Research Fellowship in 2015. She has been a consultant for Roche in the last 12 months. DLA has received research grant funding and/or personal compensation for consulting from Acorda, Adelphi, Alkermes, Biogen, Celgene, Frequency Therapeutics, Genentech, Genzyme, Hoffman-La Roche, Immuene Tolerance Network, Immunotec, MedDay, EMD Serono, Novartis, Pfizer, Receptos, Roche, Sanofi-Aventis, Canadian Institutes of Health Research, MS Society of Canada, and International Progressive MS Alliance; and holds an equity interest in NeuroRx Research.
S.N. has received research funding from the Canadian Institutes of Health Research, the International Progressive MS Alliance, the Myelin Repair Foundation and Immunotec. He has received honoraria/travel support from Genentech and MedDay, and personal compensation from NeuroRx Research. C.G.WK. receives funding from the MS Society (#77), Wings for Life (#169111), Horizon2020 (CDS-QUAMRI, #634541), BRC (#BRC704/CAP/CGW), UCL Global Challenges Research Fund (GCRF), MRC (#MR/S026088/1), Ataxia UK. C.G.WK. is a shareholder in Queen Square Analytics Ltd. F.B has received compensation for consulting services and/or speaking activities from Bayer Schering Pharma, Biogen Idec, Merck Serono, Novartis, Genzyme,Synthon BV, Roche, Teva, Jansen research and IXICO and is supported by the NIHR Biomedical Research Centre at UCLH. OC has received research grants from the MS Society of Great Britain & Northern Ireland, National Institute for Health Research (NIHR) University College London Hospitals Biomedical Research Centre, EUH2020, Spinal Cord Research Foundation, and Rosetrees Trust. She serves as a consultant for Novartis, Teva, and Roche and has received an honorarium from the American Academy of Neurology as Associate Editor of Neurology and serves on the Editorial Board of Multiple Sclerosis Journal. In the last 3 years DC is a consultant for Biogen and Hoffmann-La Roche. He has received research funding from the International Progressive MS Alliance, the MS Society, and the National Institute for Health Research (NIHR) University College London Hospitals (UCLH) Biomedical Research Centre. AE serves on the Editorial Board of Neurology. He has received speaker’s honoraria from Biogen and At The Limits educational programme, travel support from the National Multiple Sclerosis Society and honorarium from the Journal of Neurology, Neurosurgery and Psychiatry for Editorial Commentaries. AE and FB have equity stake in Queen Square Analytics. EC and JS have nothing to disclose.
Competing interests None declared.
Provenance and peer review Not commissioned; externally peer reviewed.
Supplemental material This content has been supplied by the author(s). It has not been vetted by BMJ Publishing Group Limited (BMJ) and may not have been peer-reviewed. Any opinions or recommendations discussed are solely those of the author(s) and are not endorsed by BMJ. BMJ disclaims all liability and responsibility arising from any reliance placed on the content. Where the content includes any translated material, BMJ does not warrant the accuracy and reliability of the translations (including but not limited to local regulations, clinical guidelines, terminology, drug names and drug dosages), and is not responsible for any error and/or omissions arising from translation and adaptation or otherwise.